

Bob's Burgers Pareto Analysis Example
To celebrate Hulu’s release of the Bob’s Burgers Movie, I’ve decided to re-post this article.
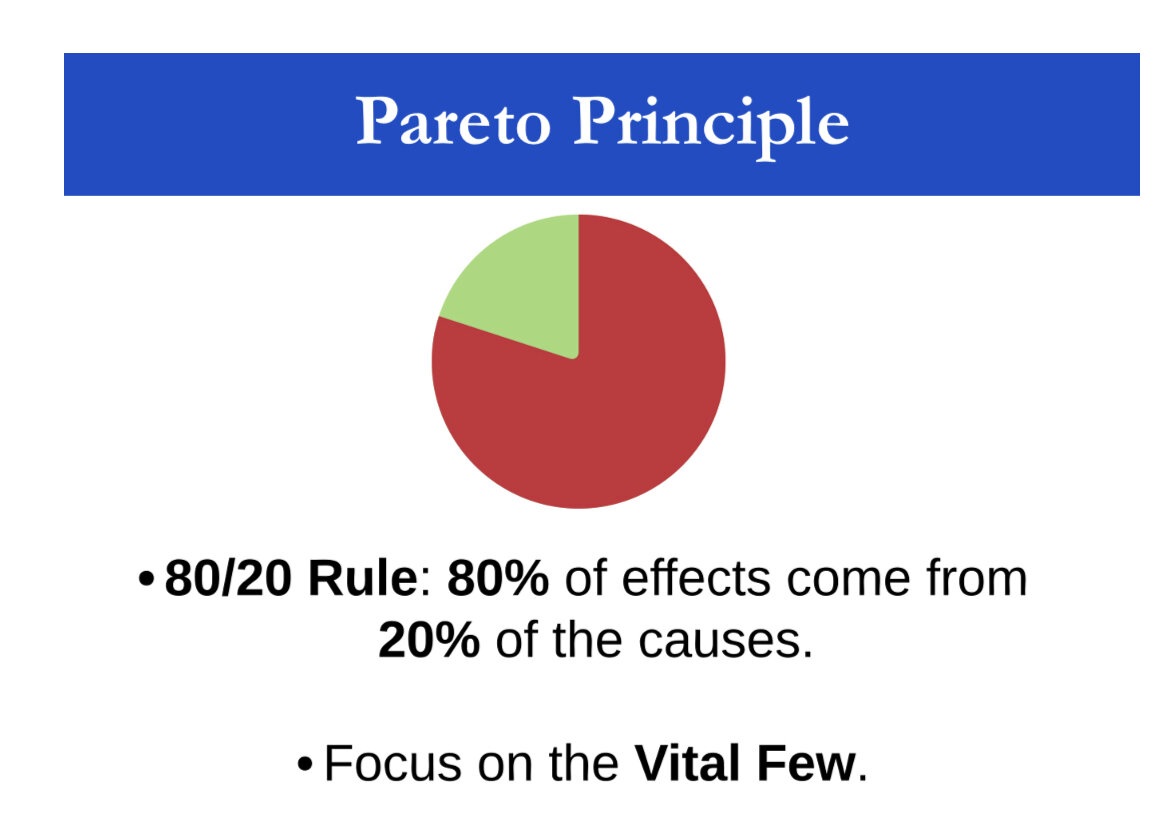
Pareto Analysis is a visual method for ranking causes from most significant to least significant. It stems from the Pareto Principle, named after a 19th-century Italian economist, which suggests that most effects (80%) derive from few causes (20%). We know this as the law of the vital few.
This method’s purpose is to help workers and teams graphically illustrate the frequency of occurrence of data/information. It enables organizations to identify critical areas ripe for change, make sound decisions, and drive improvement.
It’s an especially useful tool for supporting scientific thinking, A3 problem solving, defect identification, root cause analysis, and countermeasure selection.
Let’s look at a case study that outlines the process.

Bob’s Burgers Pareto Analysis Example
Bob’s Burgers is a local burger restaurant owned and operated by the dynamic husband and wife duo, Bob and Linda. The restaurant enjoyed moderate success the last few years, but, during the last quarter, they’ve noticed an excessive number of customer complaints (much higher than ever before), which is damaging to both their bottom-line and reputation in the community.
Their fickle landlord, Mr. Fishoeder is threatening to raise their rent if he reads any more negative reviews. These complaints are accumulating in the restaurant’s suggestion box, their email inbox, and on local restaurant review websites.
The influx of complaints is creating an untenable work environment and weighing on Bob and Linda. Satisfying their customers is their number one goal for their business, so they decide to ask their annoyingly precocious children, Tina, Gene, and Louise, to assist with gathering all the complaints accumulated during the last three months from each of the three areas.
With help from the kids, Bob and Linda used a Pareto analysis to study the data using the following steps:
Determine the measurement to use.
Bob and Linda decide to track complaints by the frequency of occurrence.
Decide on time-frame to study.
Bob and Linda decide to track the frequency of occurrence for the last three months.
Collect the data and sort it into logical categories.
Bob, Linda, and the kids collected the data and grouped the complaint types into eight distinct categories.
Presentation
Cleanliness
Affordability
Timeliness
Overall Service
Taste
Atmosphere
Serving size
Once Bob and Linda analyze this data, they’ll be able to identify the most common categories of complaints and target their corrective measures.
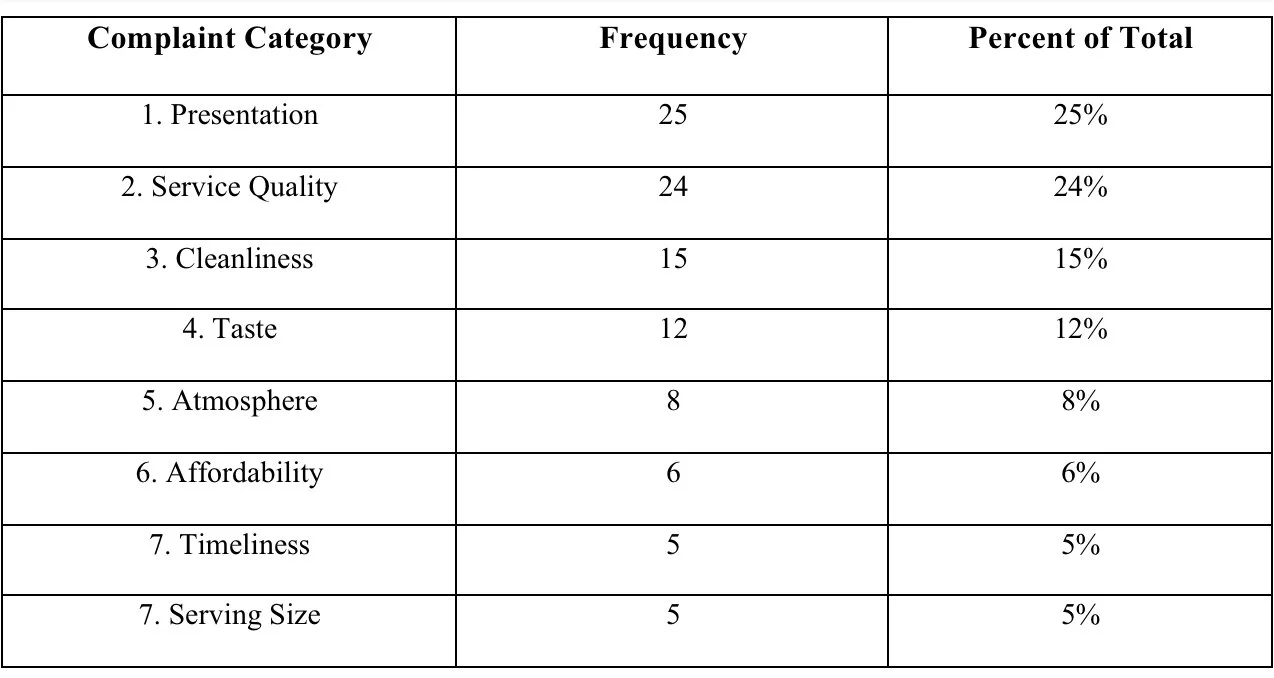
4. Add up all the complaints, add up the frequency of occurrence for each category, and insert the data into a table.

5. Rank each category of complaints from the most frequent occurrence to the least frequent and insert it into a table.

6. Calculate the percentage of each category and enter it into a table.
-the subtotal for that category divided by the overall total multiplied by the overall total
For example, the most prevalent source of complaints is Food Presentation with 25.
25 divided by 100 times 100 = 25%
· Food Presentation’s contribution to the overall complaints is 25%
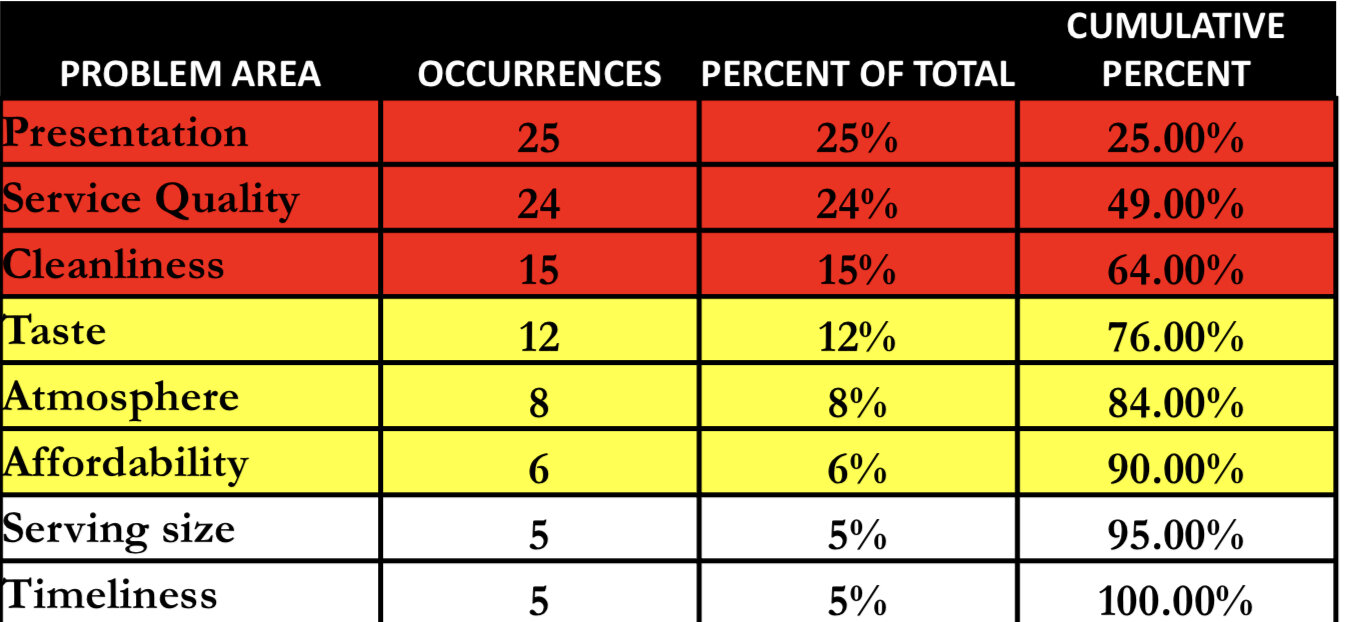
7. Calculate the cumulative percentage for each category.
25 + 24 = 49%
49 + 15 = 64%
64 + 12 = 76%
76 + 8 = 84%
84 + 6 = 90%
90 + 5 = 95%
95 +5 = 100%
8. Insert categories, frequency of occurrence, contributory percent, and cumulative percent data into Pareto table.
9. Draw Pareto bar graph or construct in software.
Bob and Linda entered the data into spreadsheet software.

10. Analyze the results.
Using this data, Bob and Linda discover 80% of complaints involve presentation, service quality, cleanliness, and taste. There’s unequal distribution of causes and effects – 80% of the complaints are caused by 50% of the factors. This shows that the 80/20 threshold isn’t always met.
Bob and Linda should focus their time and resources on addressing the top four reasons for customer complaints:
1. Food Presentation – 25%
2. Quality of Service– 24%
3. Cleanliness – 15%
4. Overall Taste – 12%
Focusing Lean improvement efforts on these four categories would effectively resolve 80% of the complaints.
Without conducting a Pareto analysis, Bob and Linda wouldn’t have a factual basis to rely on in their decision-making, wasting time and resources on minor issues like Affordability, Serving Size, and Timeliness.
Bob’s Burgers can now focus on eliminating the most common sources of customer complaints, tailoring corrective measures to these areas, and providing higher value to its’ customers.
#leanjax #pareto #A3 #continuousimprovement #leanthinking #problem solving
· .